Monitor performance.
Track energy-centre, substation, distribution and customer-side KPIs from live meter and BMS data.
Connect your energy centres, meters and heat interface units. See where energy is lost, what needs attention and where your evidence stands.
Start with the detail. Follow the heat from supply to return, then bring the whole network into focus.
SCROLL TO EXPLOREBring BMS, LoRaWAN metering and field data together to understand performance across the whole network.
Monitors boilers, CHP, heat pumps and biomass plant to track generation efficiency, run hours and fuel-to-heat conversion against HNTAS targets for each plant type.
Compares heat generated against heat delivered to measure distribution losses across the network - flagging the sections quietly wasting energy before they hit your bills.
Tracks each heat interface unit's return temperature and volume-weighted average return temperature (VWART) to find under-performing dwellings dragging down whole-network efficiency.
Continuously validates heat, gas, electricity and water meter data for completeness and accuracy - the evidence base for fair, compliant customer billing.
Calculates the carbon intensity of delivered heat and benchmarks it against decarbonisation and Green Heat Network Fund thresholds.
Monitors differential pressure, flow and operating pressure across the network to catch hydraulic issues, exceedances and pump inefficiency early.
Detects meter drop-outs, sensor faults, impossible readings and performance drift automatically - so data-quality problems don't quietly become compliance failures.
Computes your HNTAS KPIs - energy centre, substation, distribution and customer-side - directly from live data and shows exactly where each network passes, fails or lacks evidence.
Turns raw meter and BMS data into dated, evidenced reports aligned to Ofgem returns, HNTAS assurance and internal audit timelines - generated automatically.
Predictive plant maintenance, demand optimisation and automated Ofgem data returns - the next step in intelligent heat-network operation.
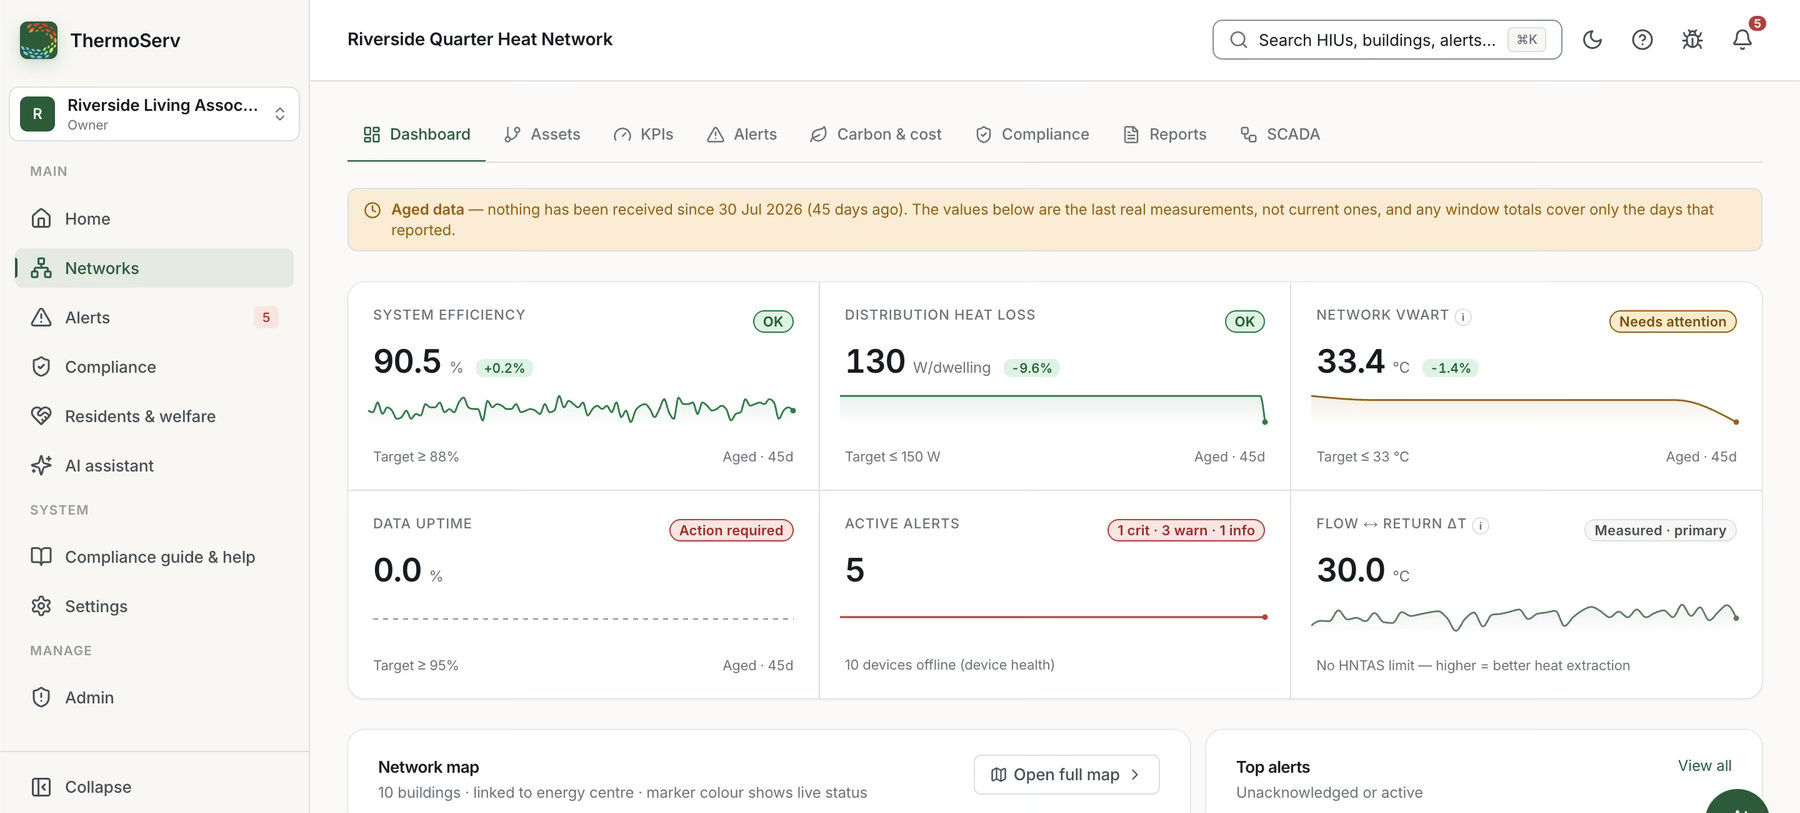
Review system efficiency, distribution heat loss, flow and return temperatures, and alerts together. Check the age and completeness of the data alongside the numbers.
Track energy-centre, substation, distribution and customer-side KPIs from live meter and BMS data.
Bring HNTAS readiness, Ofgem regulation, metering and billing, CP1 and carbon standards into one compliance view.
Keep dated readings, KPIs and reports together. Flag data-quality anomalies before they undermine your reporting.
Put reliable data in the hands of the people who can make a difference.
Find distribution losses, inefficient plant and under-performing dwellings to help reduce fuel spend and emergency callouts.
Automate data collection, KPI computation and reporting. Give asset teams more time to act on what the information shows.
Bring your readings and supporting evidence together for assurance, customer reporting and board-level decisions.
A free two-minute self-assessment against the new Ofgem heat-network regime, the residual metering rules and HNTAS readiness. Get an indicative view of your risk areas and next steps. This self-assessment is a starting point for review, not a formal compliance determination.
Bring LoRaWAN heat and utility meters, building management systems, asset records and billing workflows into one connected approach.
At the sourceConnect readings from meters and building systems.
In contextRelate performance and data quality to each network.
With your teamUse the findings to guide investigation and reporting.
Let’s look at your network, your obligations
and the outcomes you want to achieve.